

wo-wo- wonige?
2025
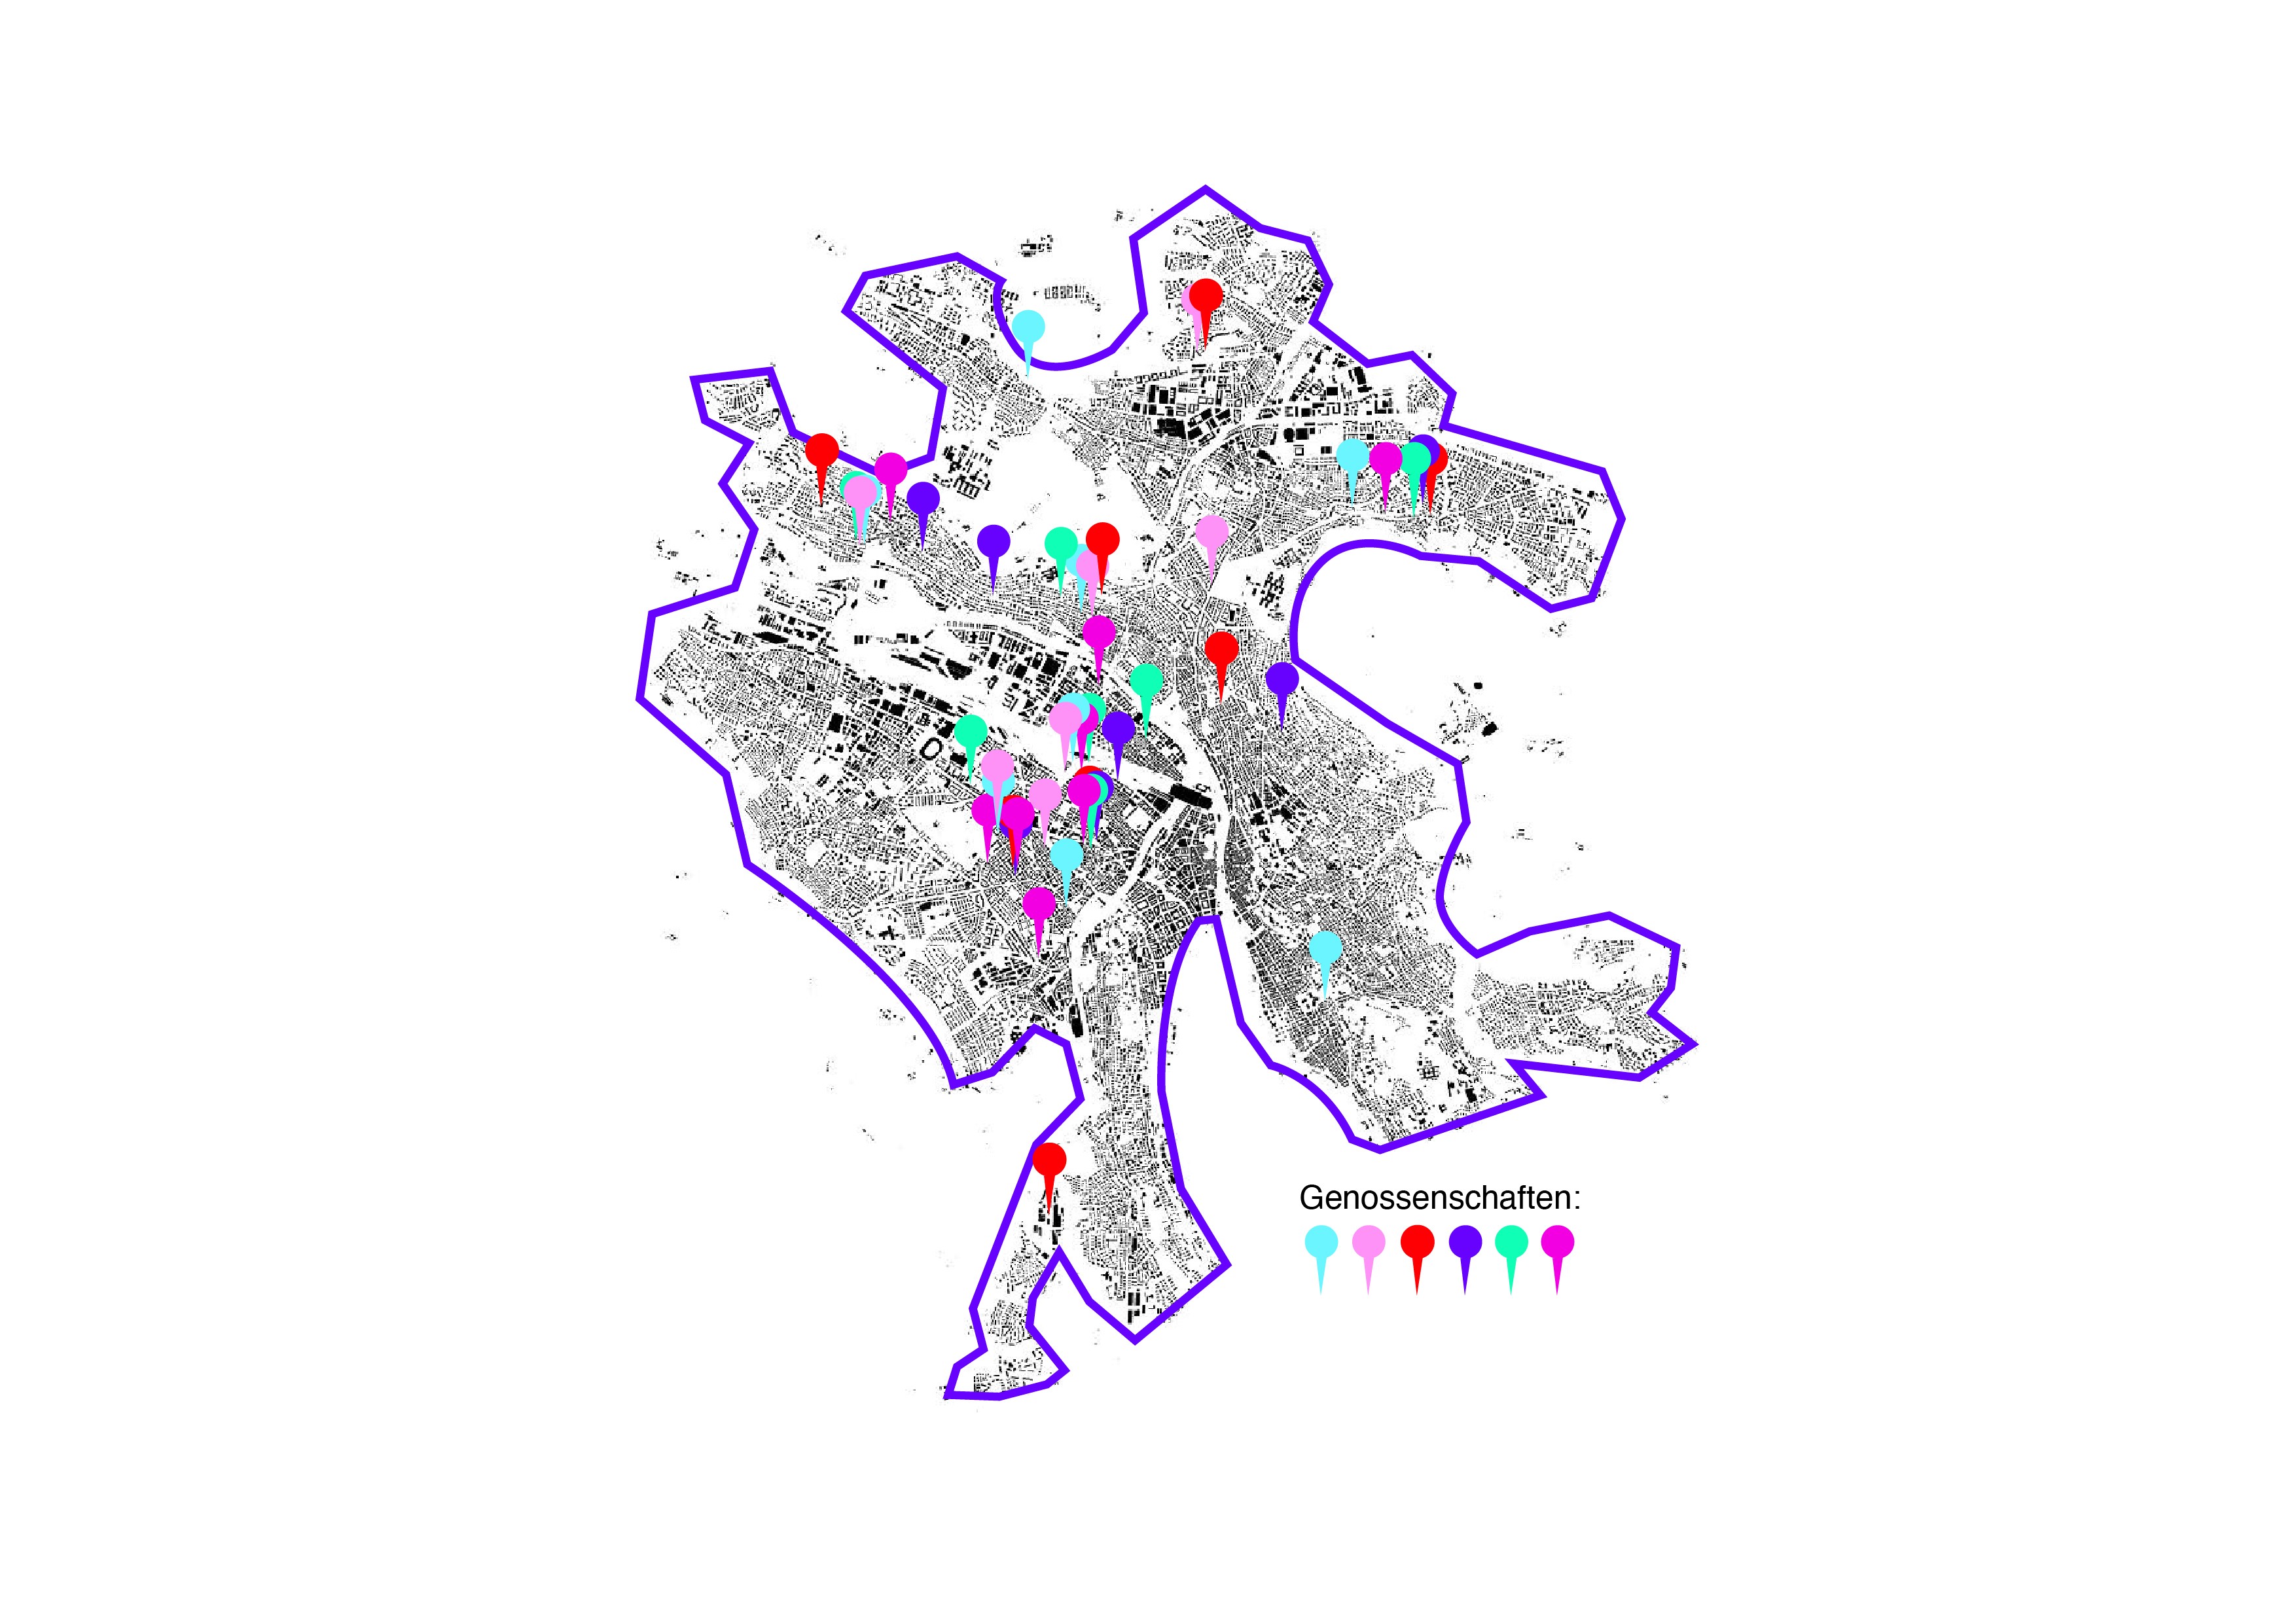
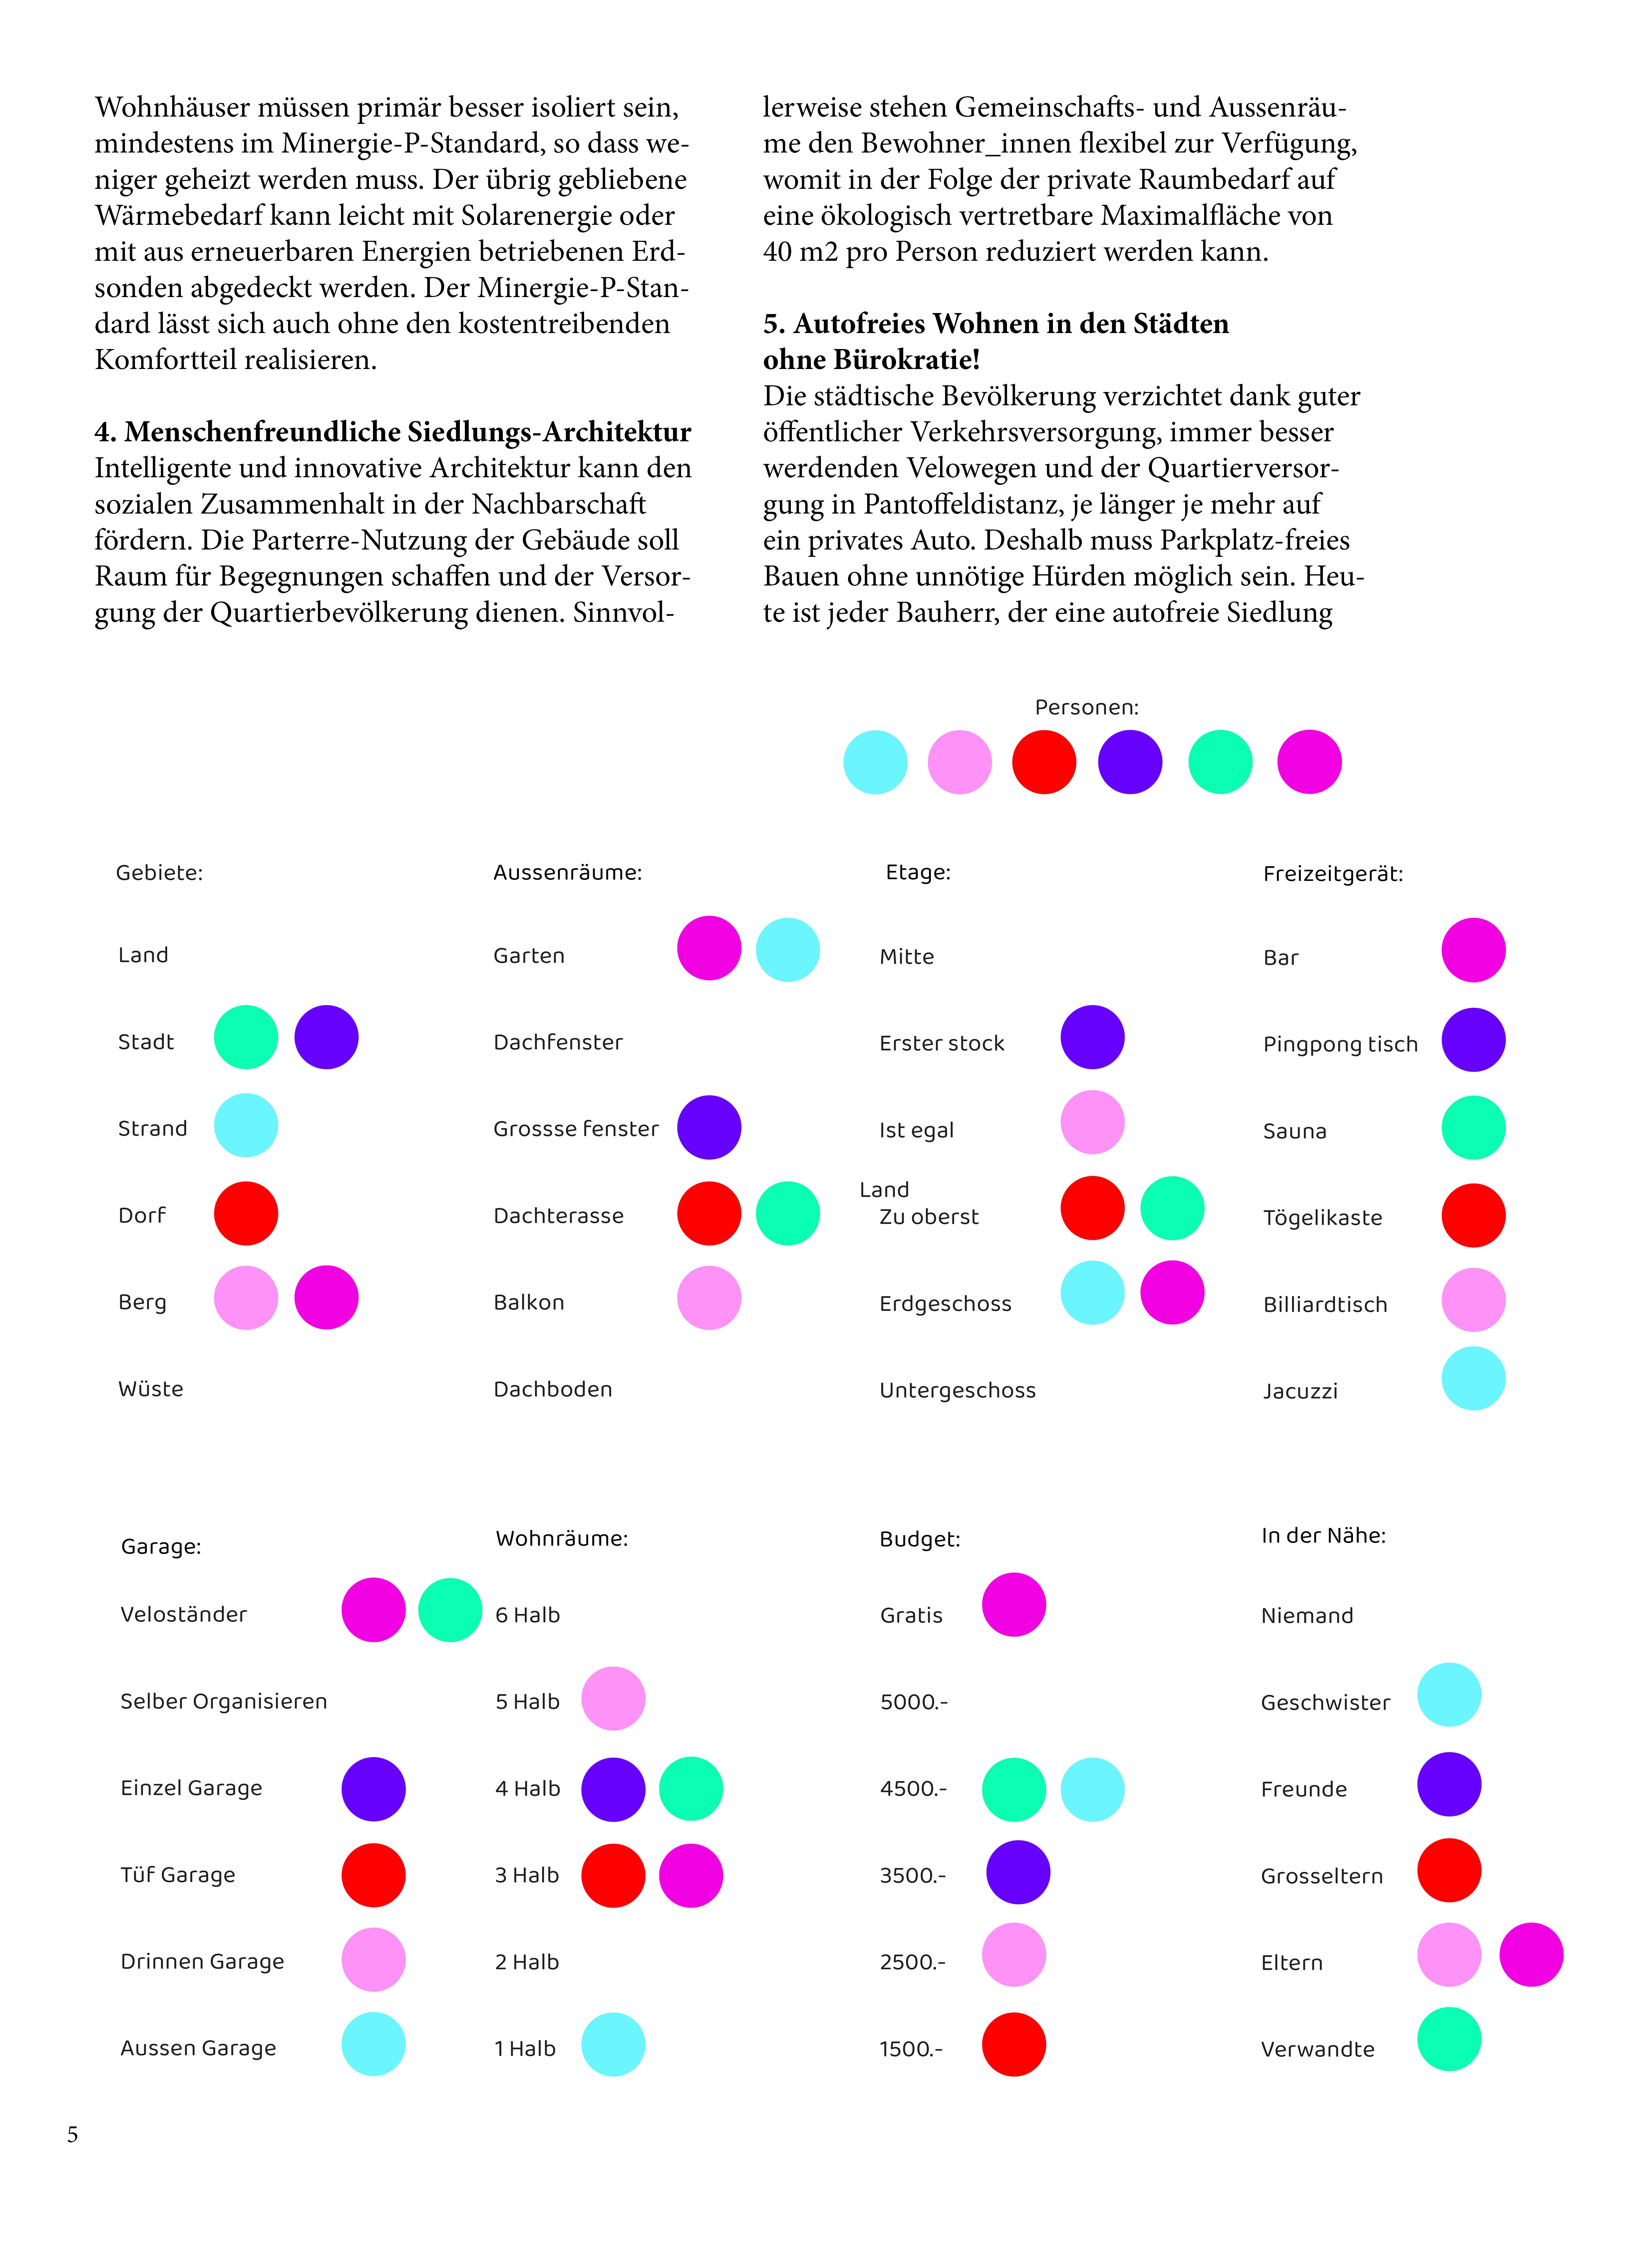
EN: An infographic and statistical overview of housing in the Canton of Zurich. The design uses bold, vibrant colours to make the statistical information more engaging and easier to understand. Geometric shapes and objects create a clear, modern and visually appealing presentation of the data.
ES: Una infografía y representación estadística sobre la vivienda en el cantón de Zúrich. El diseño utiliza colores intensos y llamativos para hacer que la información estadística sea más interesante y fácil de comprender. Las formas y objetos geométricos crean una presentación clara, moderna y visualmente atractiva de los datos.
ES: Lucha Libre Estadio es un concepto ficticio de señalética para un estadio de lucha libre en Ciudad de México. El sistema facilita la orientación dentro del estadio y, al mismo tiempo, refleja la identidad visual de la lucha libre. Los pictogramas están inspirados en las características máscaras de los luchadores y transforman sus formas y patrones en un sistema de señalización claro y reconocible.
wo-wo- wohnige?
Infographic design
2025
ES: Una infografía y representación estadística sobre la vivienda en el cantón de Zúrich. El diseño utiliza colores intensos y llamativos para hacer que la información estadística sea más interesante y fácil de comprender. Las formas y objetos geométricos crean una presentación clara, moderna y visualmente atractiva de los datos.
EN: An infographic and statistical overview of housing in the Canton of Zurich. The design uses bold, vibrant colours to make the statistical information more engaging and easier to understand. Geometric shapes and objects create a clear, modern and visually appealing presentation of the data.
wo-wo- wohnige?
Infographic design
2025
EN: An infographic and statistical overview of housing in the Canton of Zurich. The design uses bold, vibrant colours to make the statistical information more engaging and easier to understand. Geometric shapes and objects create a clear, modern and visually appealing presentation of the data.
ES: Una infografía y representación estadística sobre la vivienda en el cantón de Zúrich. El diseño utiliza colores intensos y llamativos para hacer que la información estadística sea más interesante y fácil de comprender. Las formas y objetos geométricos crean una presentación clara, moderna y visualmente atractiva de los datos.